How to join our beta program?
The worlds most advanced business analytics software (Beta)
At Datafly we use state-of-the art algorithms to analyze business transaction data from POS devices real-time. We provide detailed reports on dynamic pricing, inventory diversification, consumer demand, and so much more! Within minutes of uploading your dataset, you’ll have a detailed and actionable report ready for you.
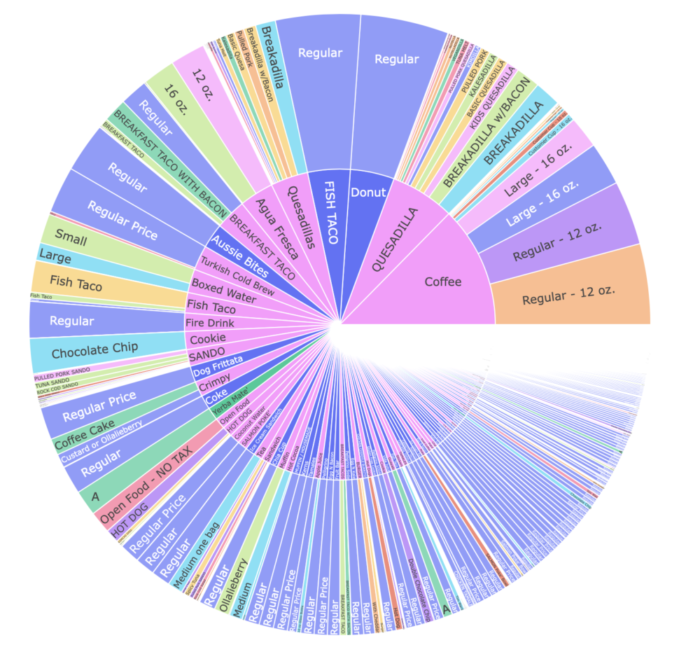
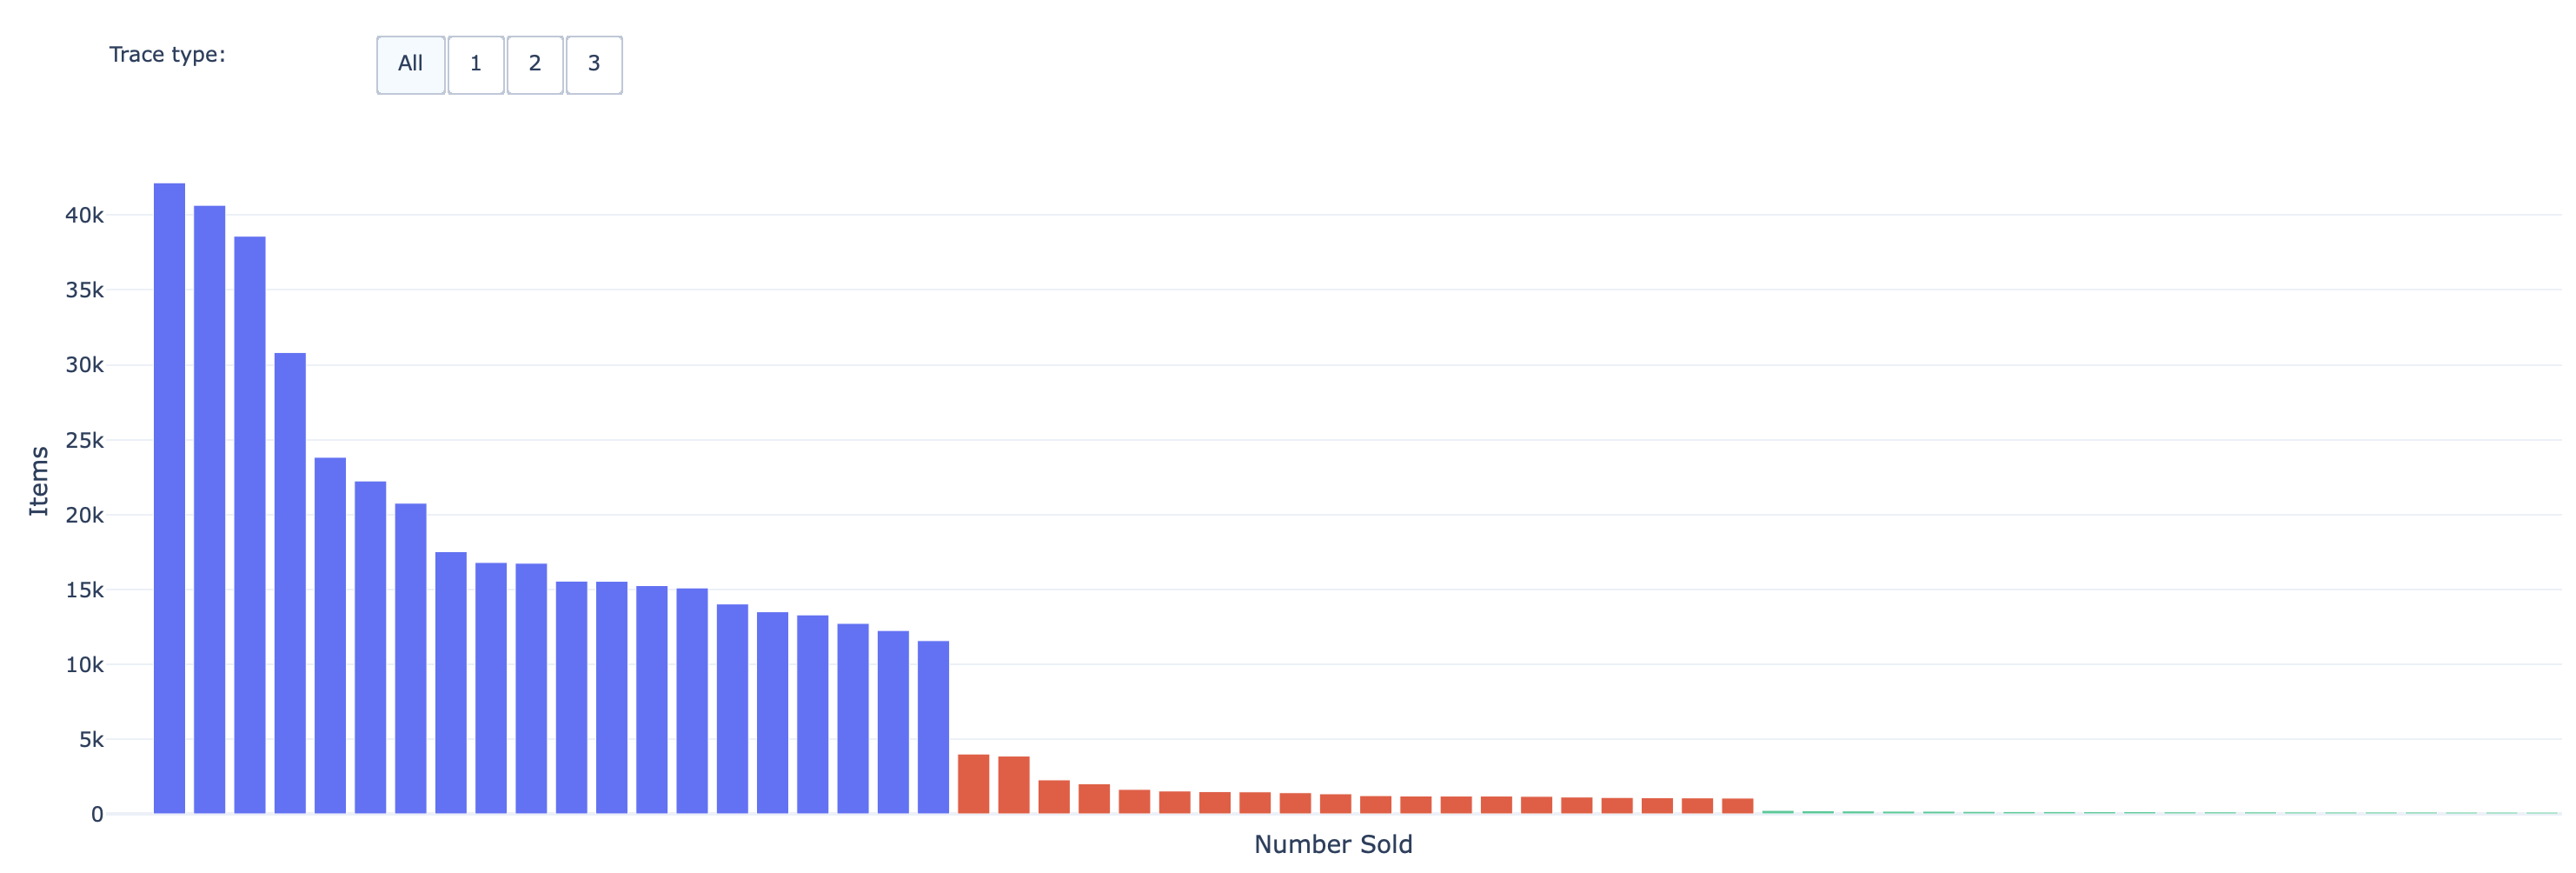
Inventory Diversification
Identify the best selling goods and their sub-categories
Description: Having the right balance of inventory diversification is a daunting issue for many small businesses. In this module we help identify what goods are being purchased the most so you can order more of these goods.
Frequently Bought Items
Identify what goods are selling the best alone and in combination
Description: Finding out what items are frequently bought together are crucial for putting those items in similar spots of the store, selling items as bundled goods, and discovering unforeseen trends. In this module we show what items are bought the most as bundled goods.
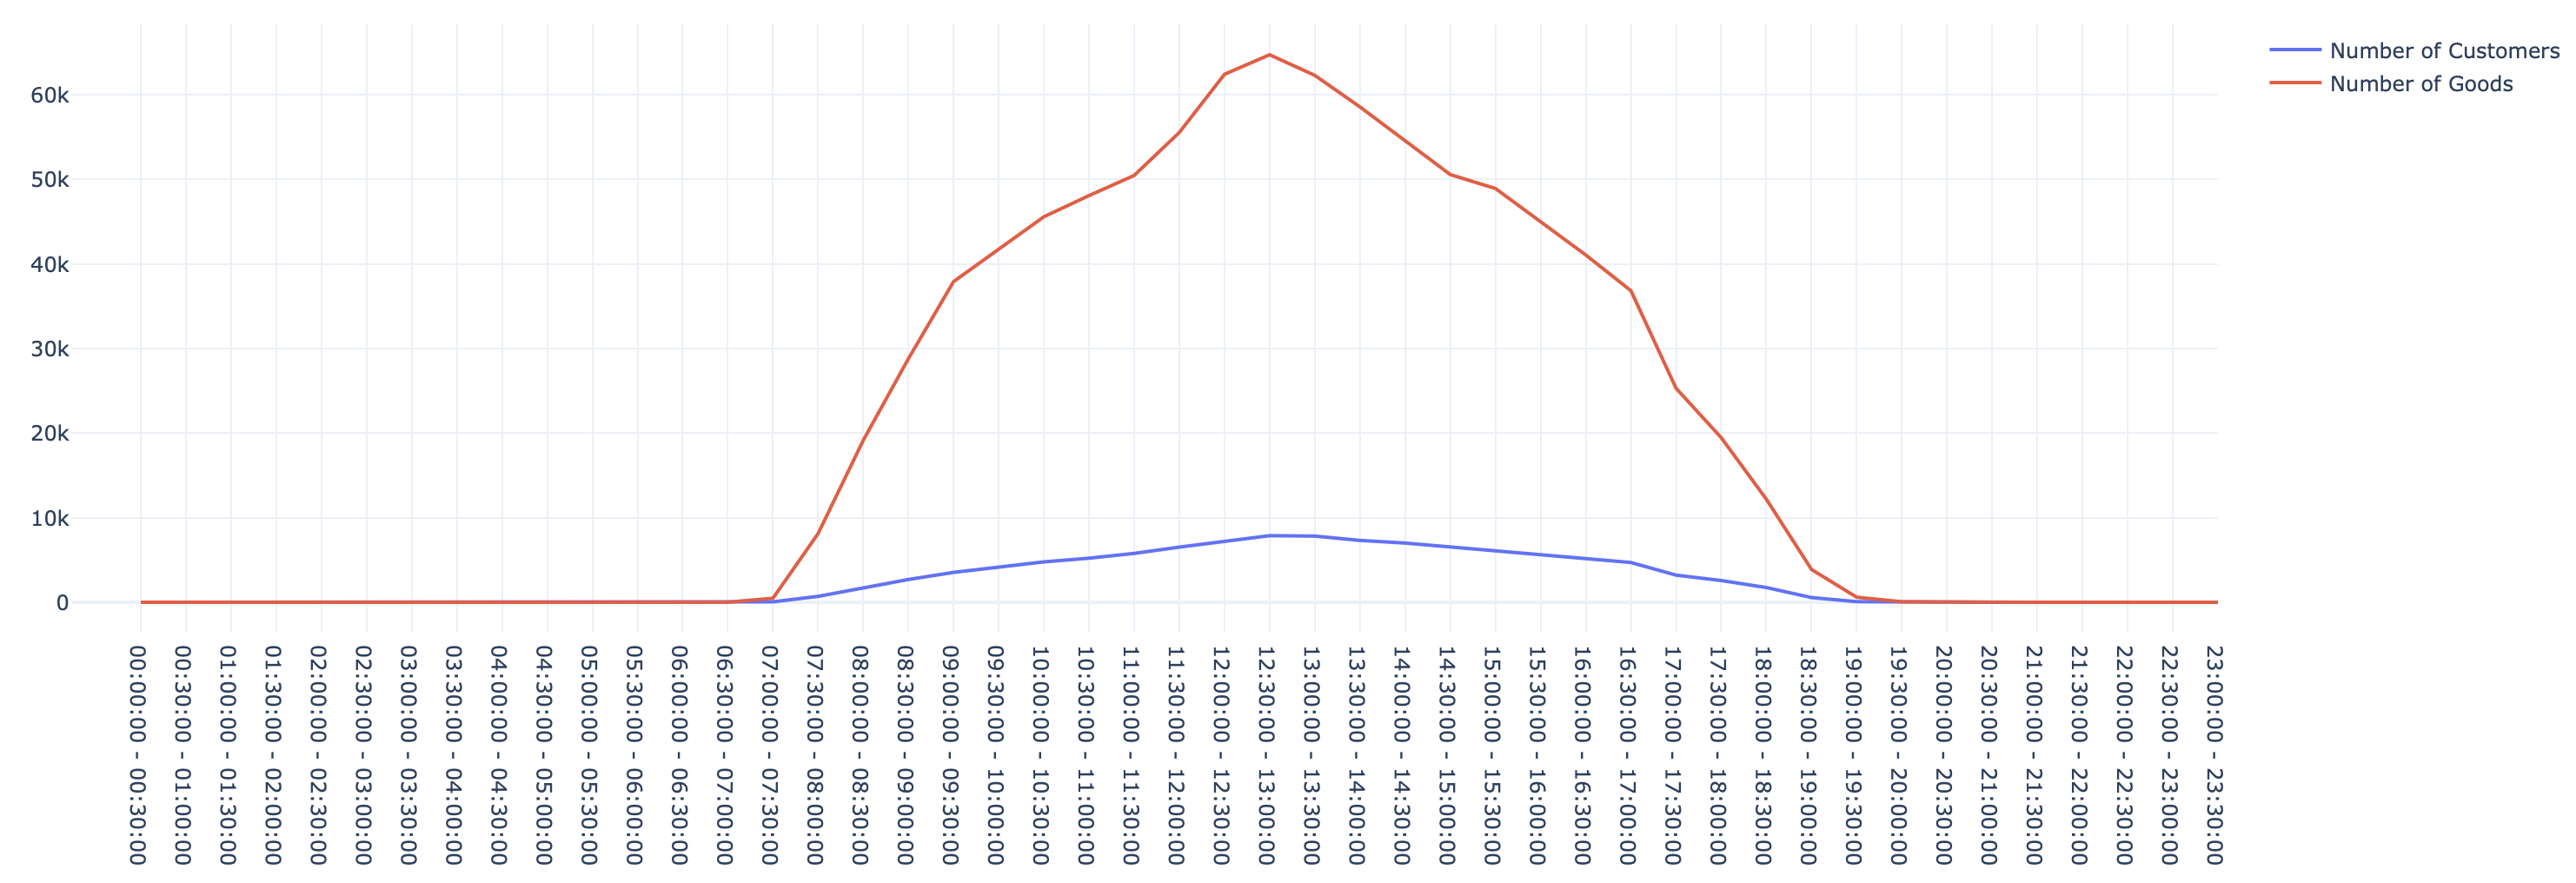
Peak Hours
Identify when the most popular times of the day are
Description: Finding out the peak hours of each day is essential for staffing employees. In this module we show what times of the day the most items are sold and when the most customers come in.
Seasonality
Identify how well goods are performing at different times of the years
Description: Seasonality is useful towards identifying over and under-performing goods. One can identify historical trends by looking at the seasonality graph. In this module we show how different prices throughout the year are performing.
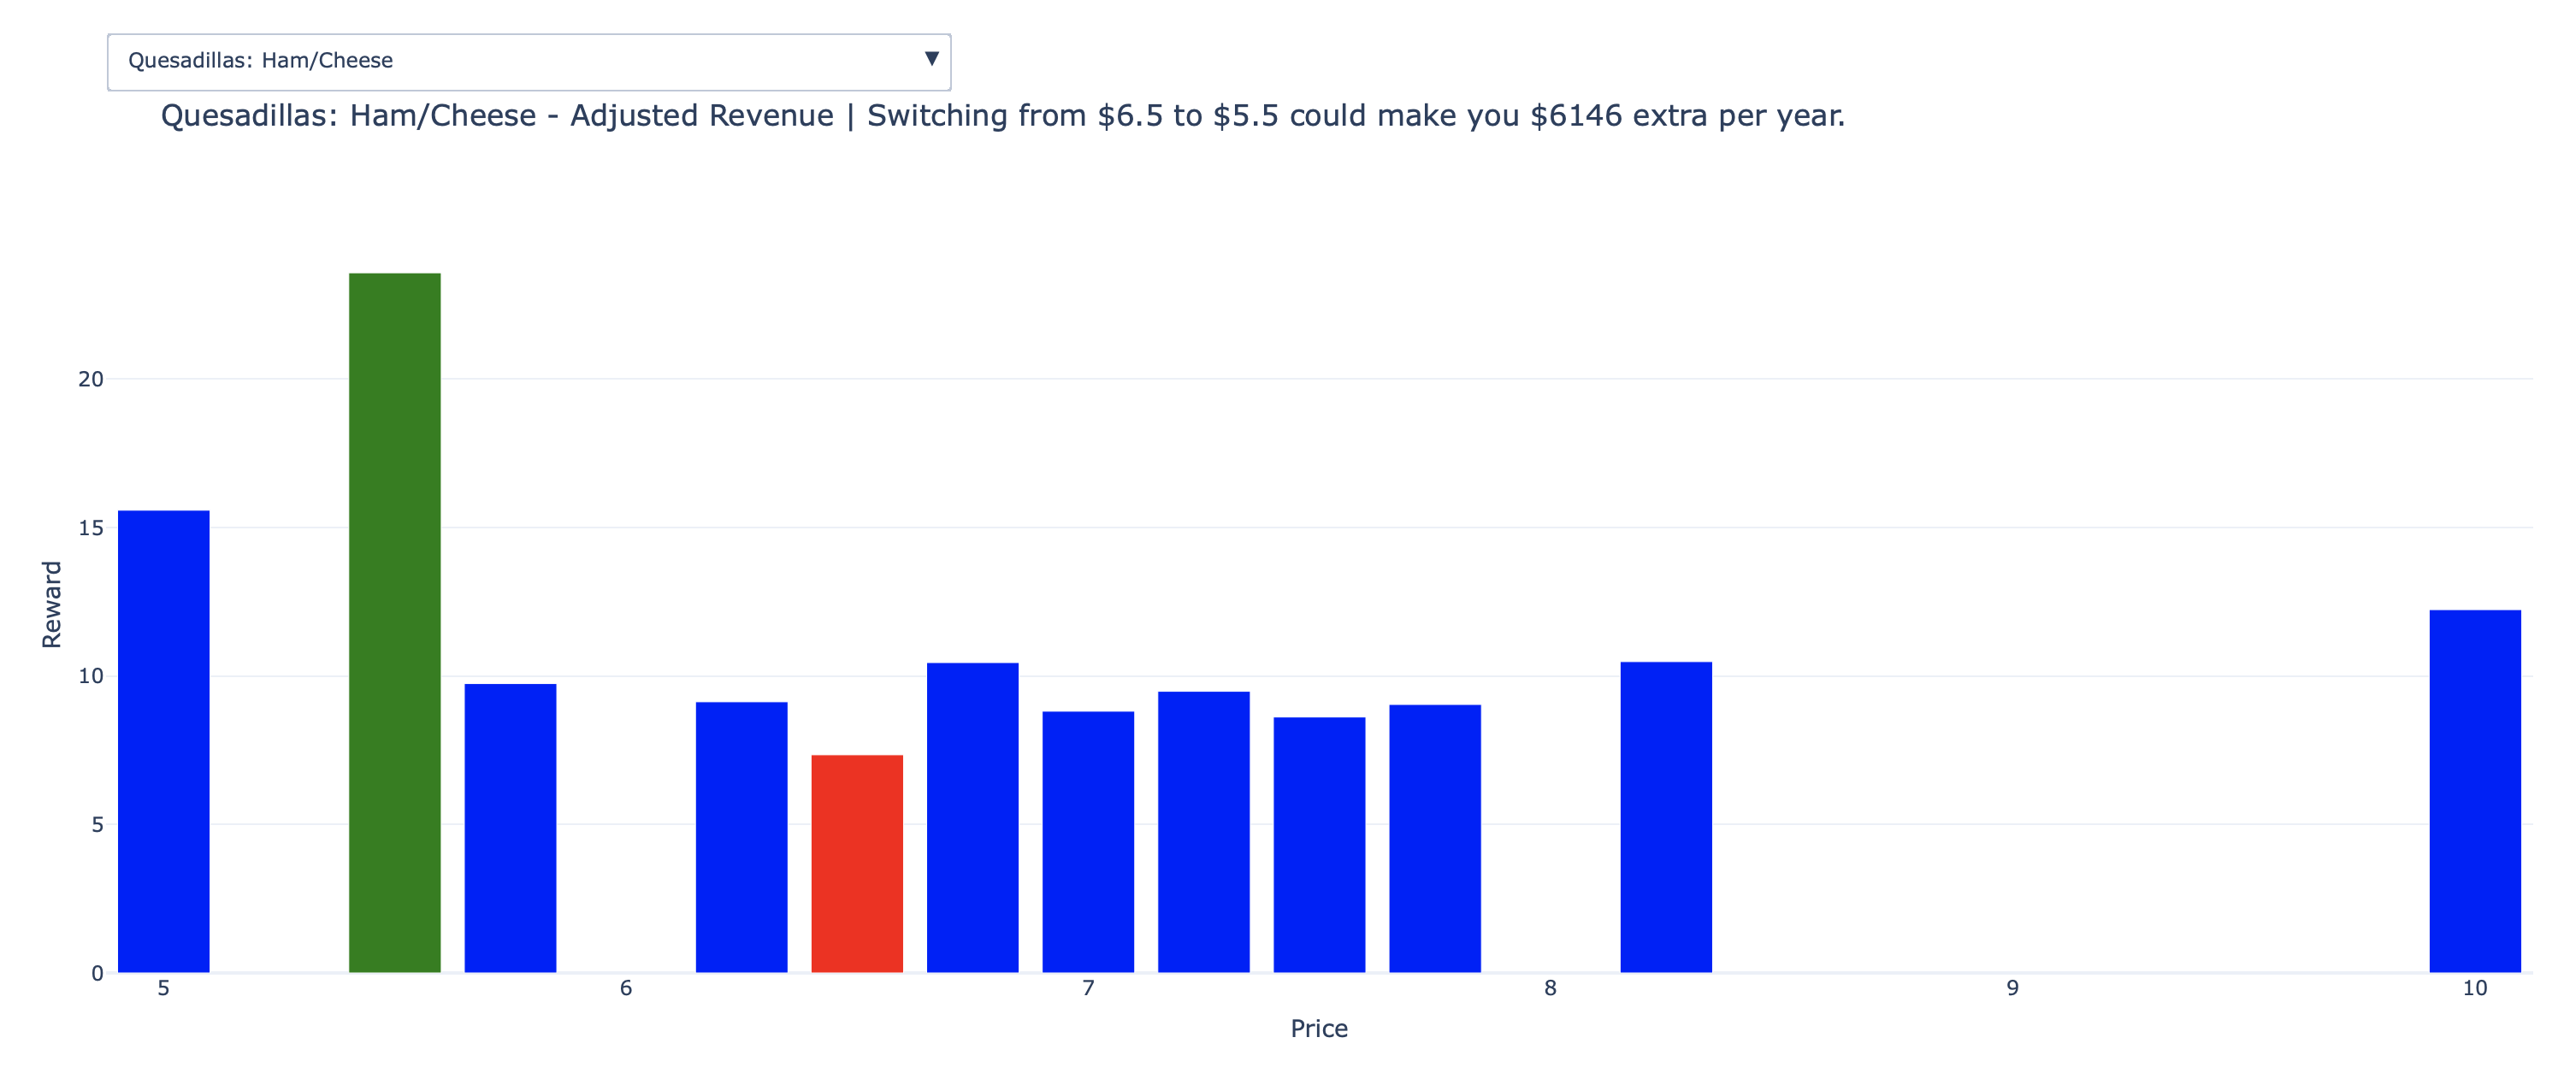
Dynamic Pricing
Identify the specific prices you should use and anticipated benefits
Description: Optimal pricing is crucial toward identifying products that are incorrectly priced. The dynamic pricing module helps identify the optimal price for each good.
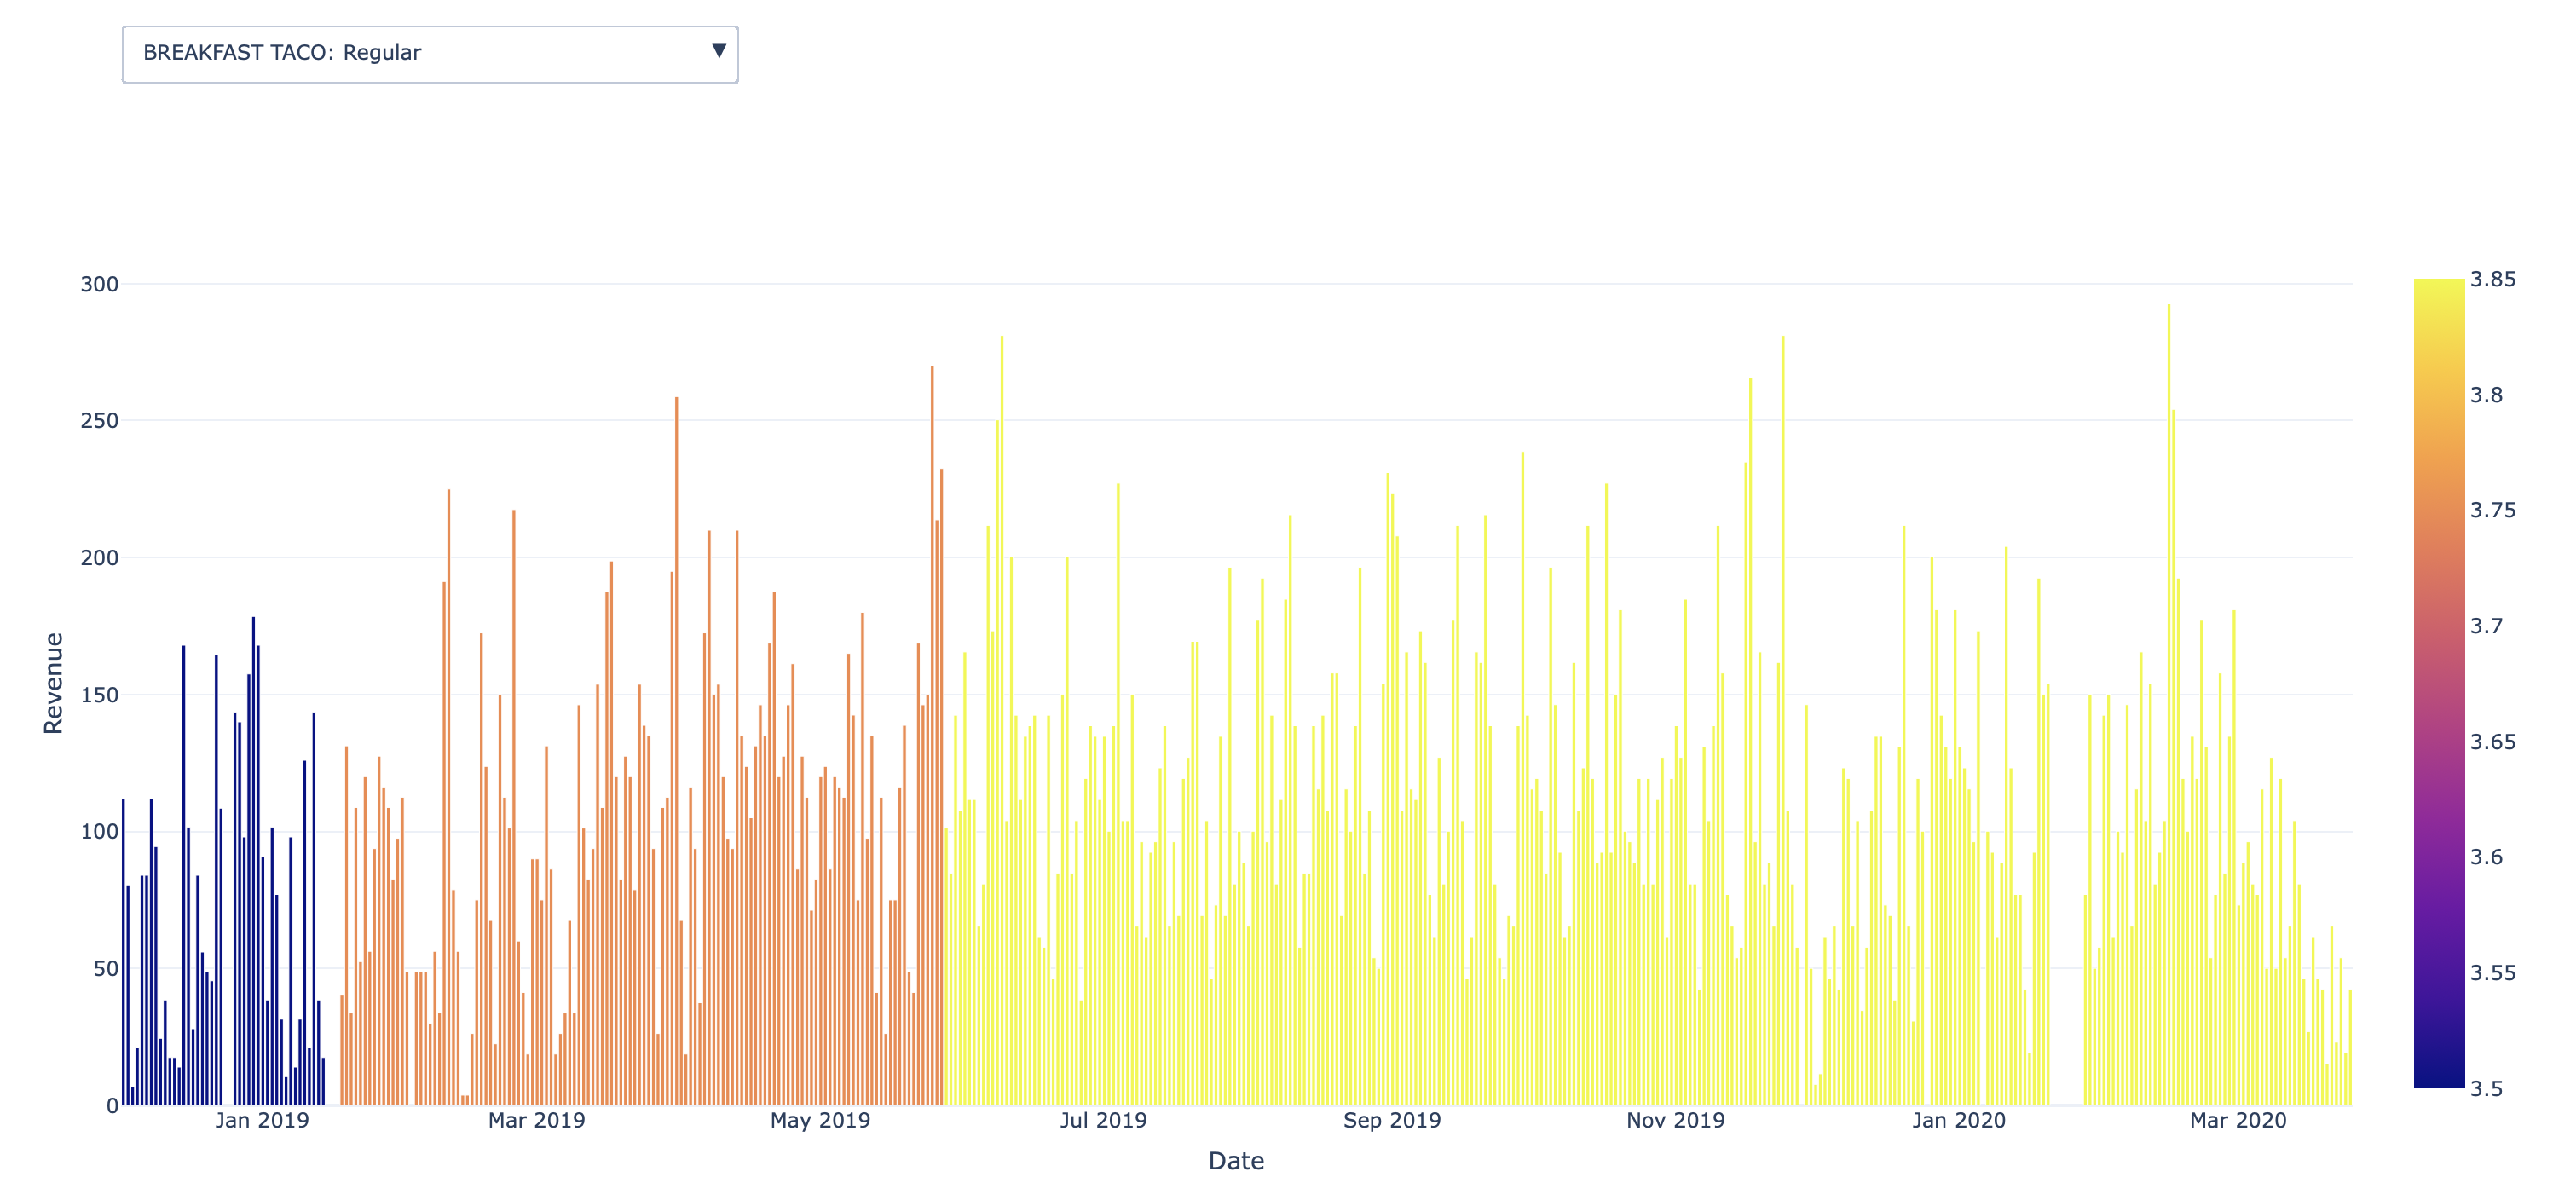
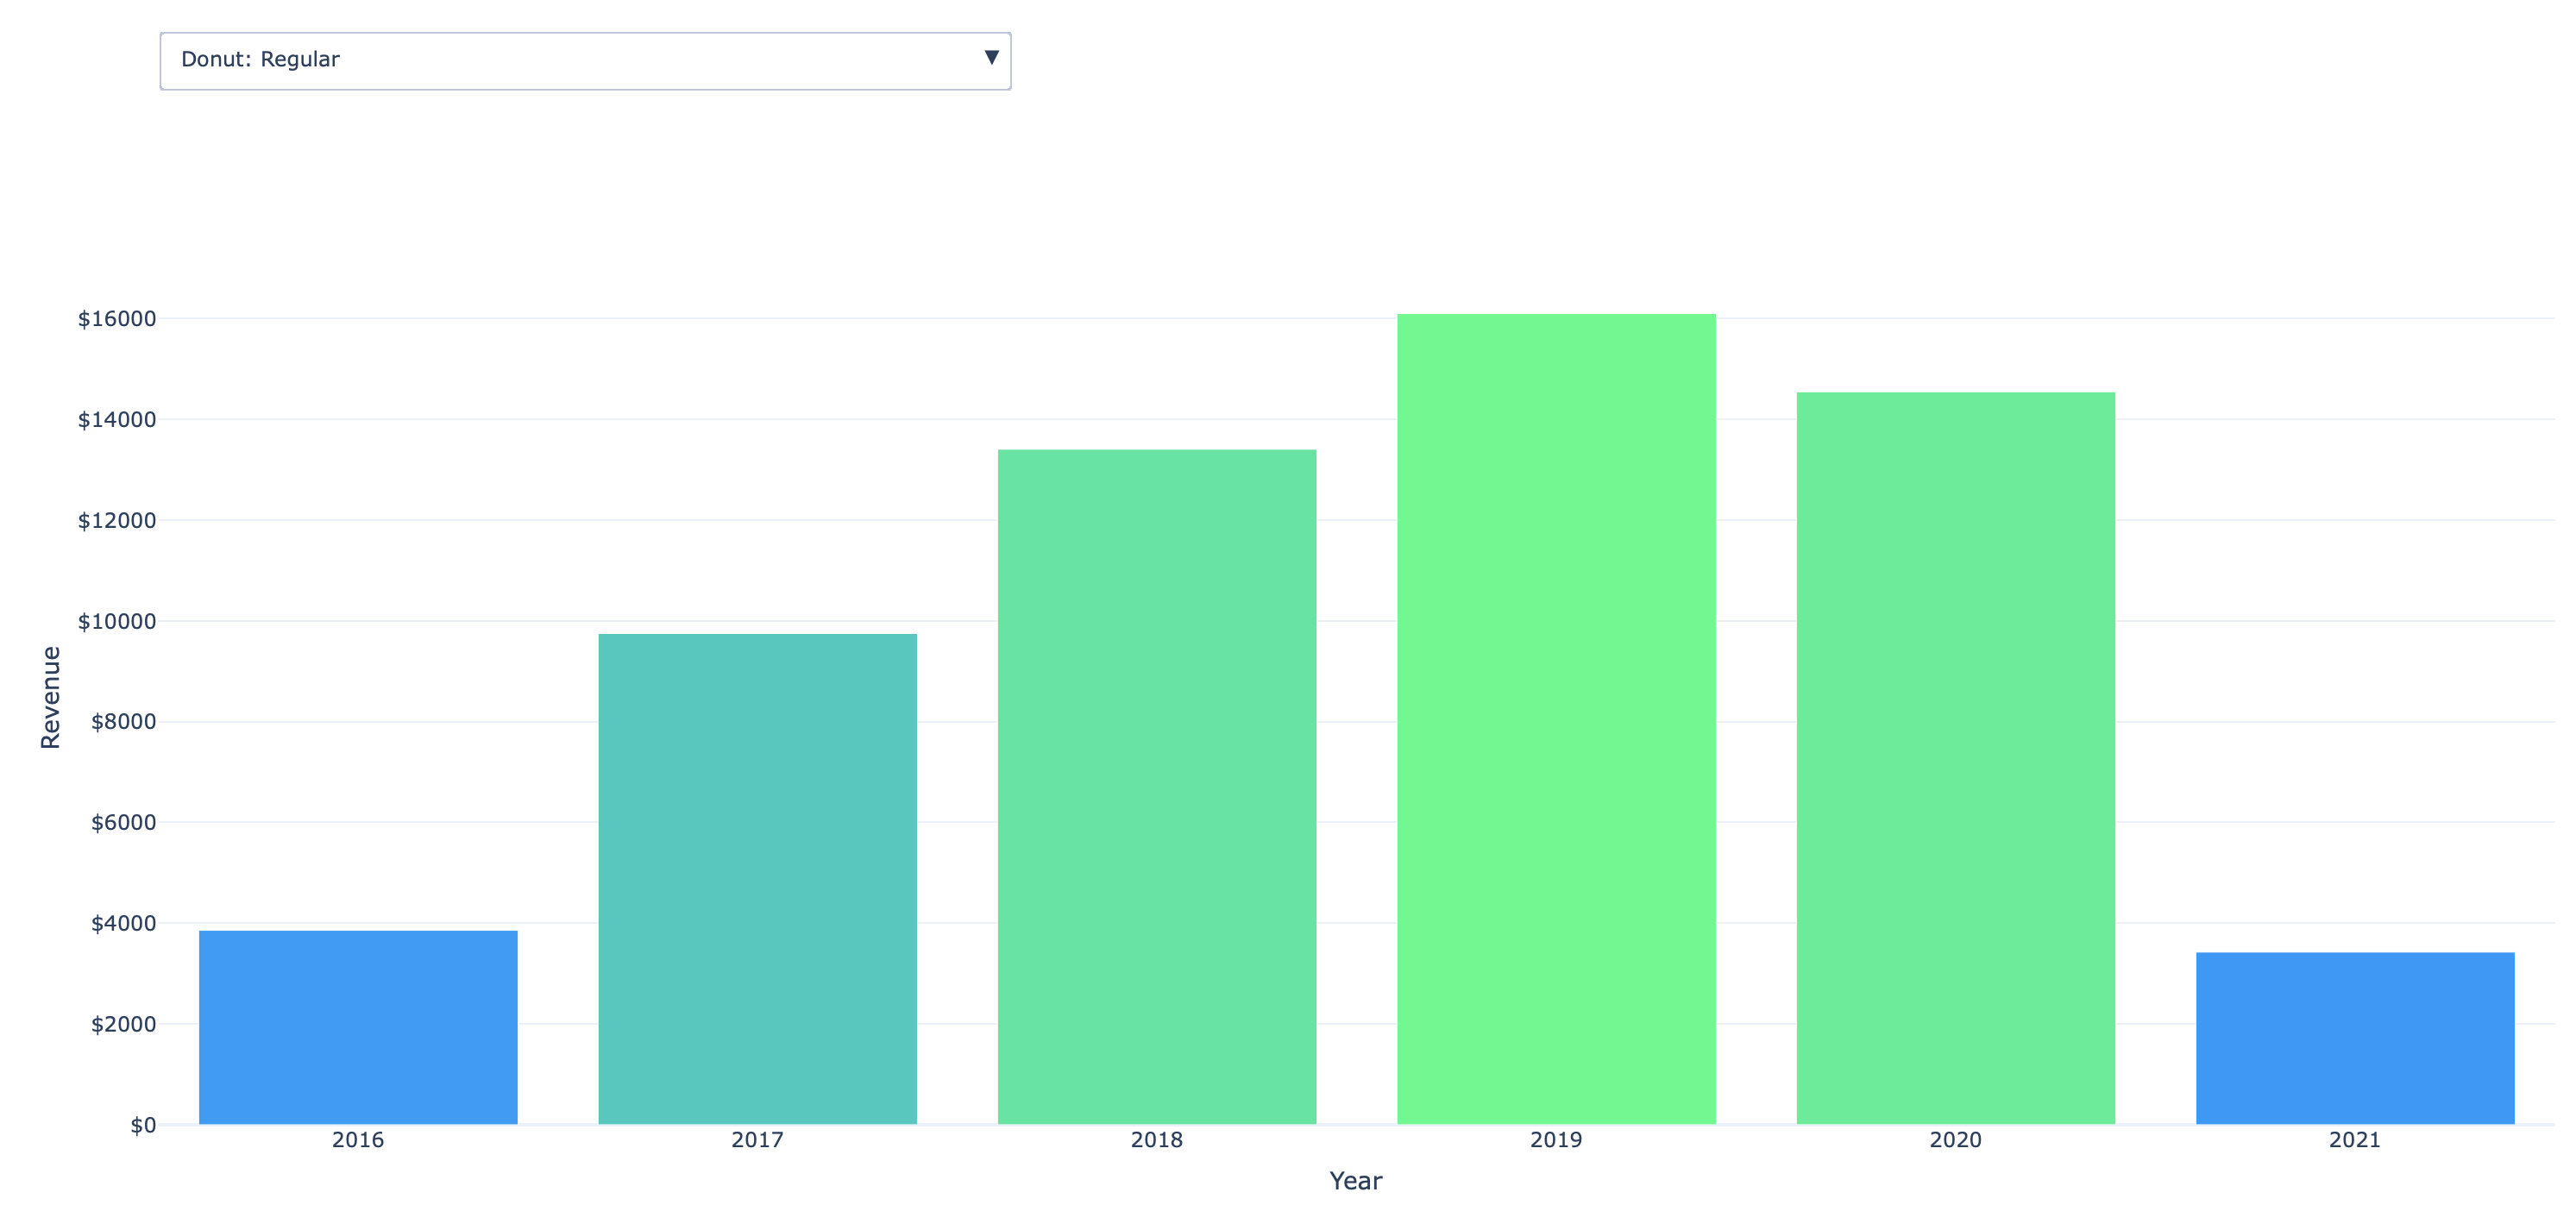
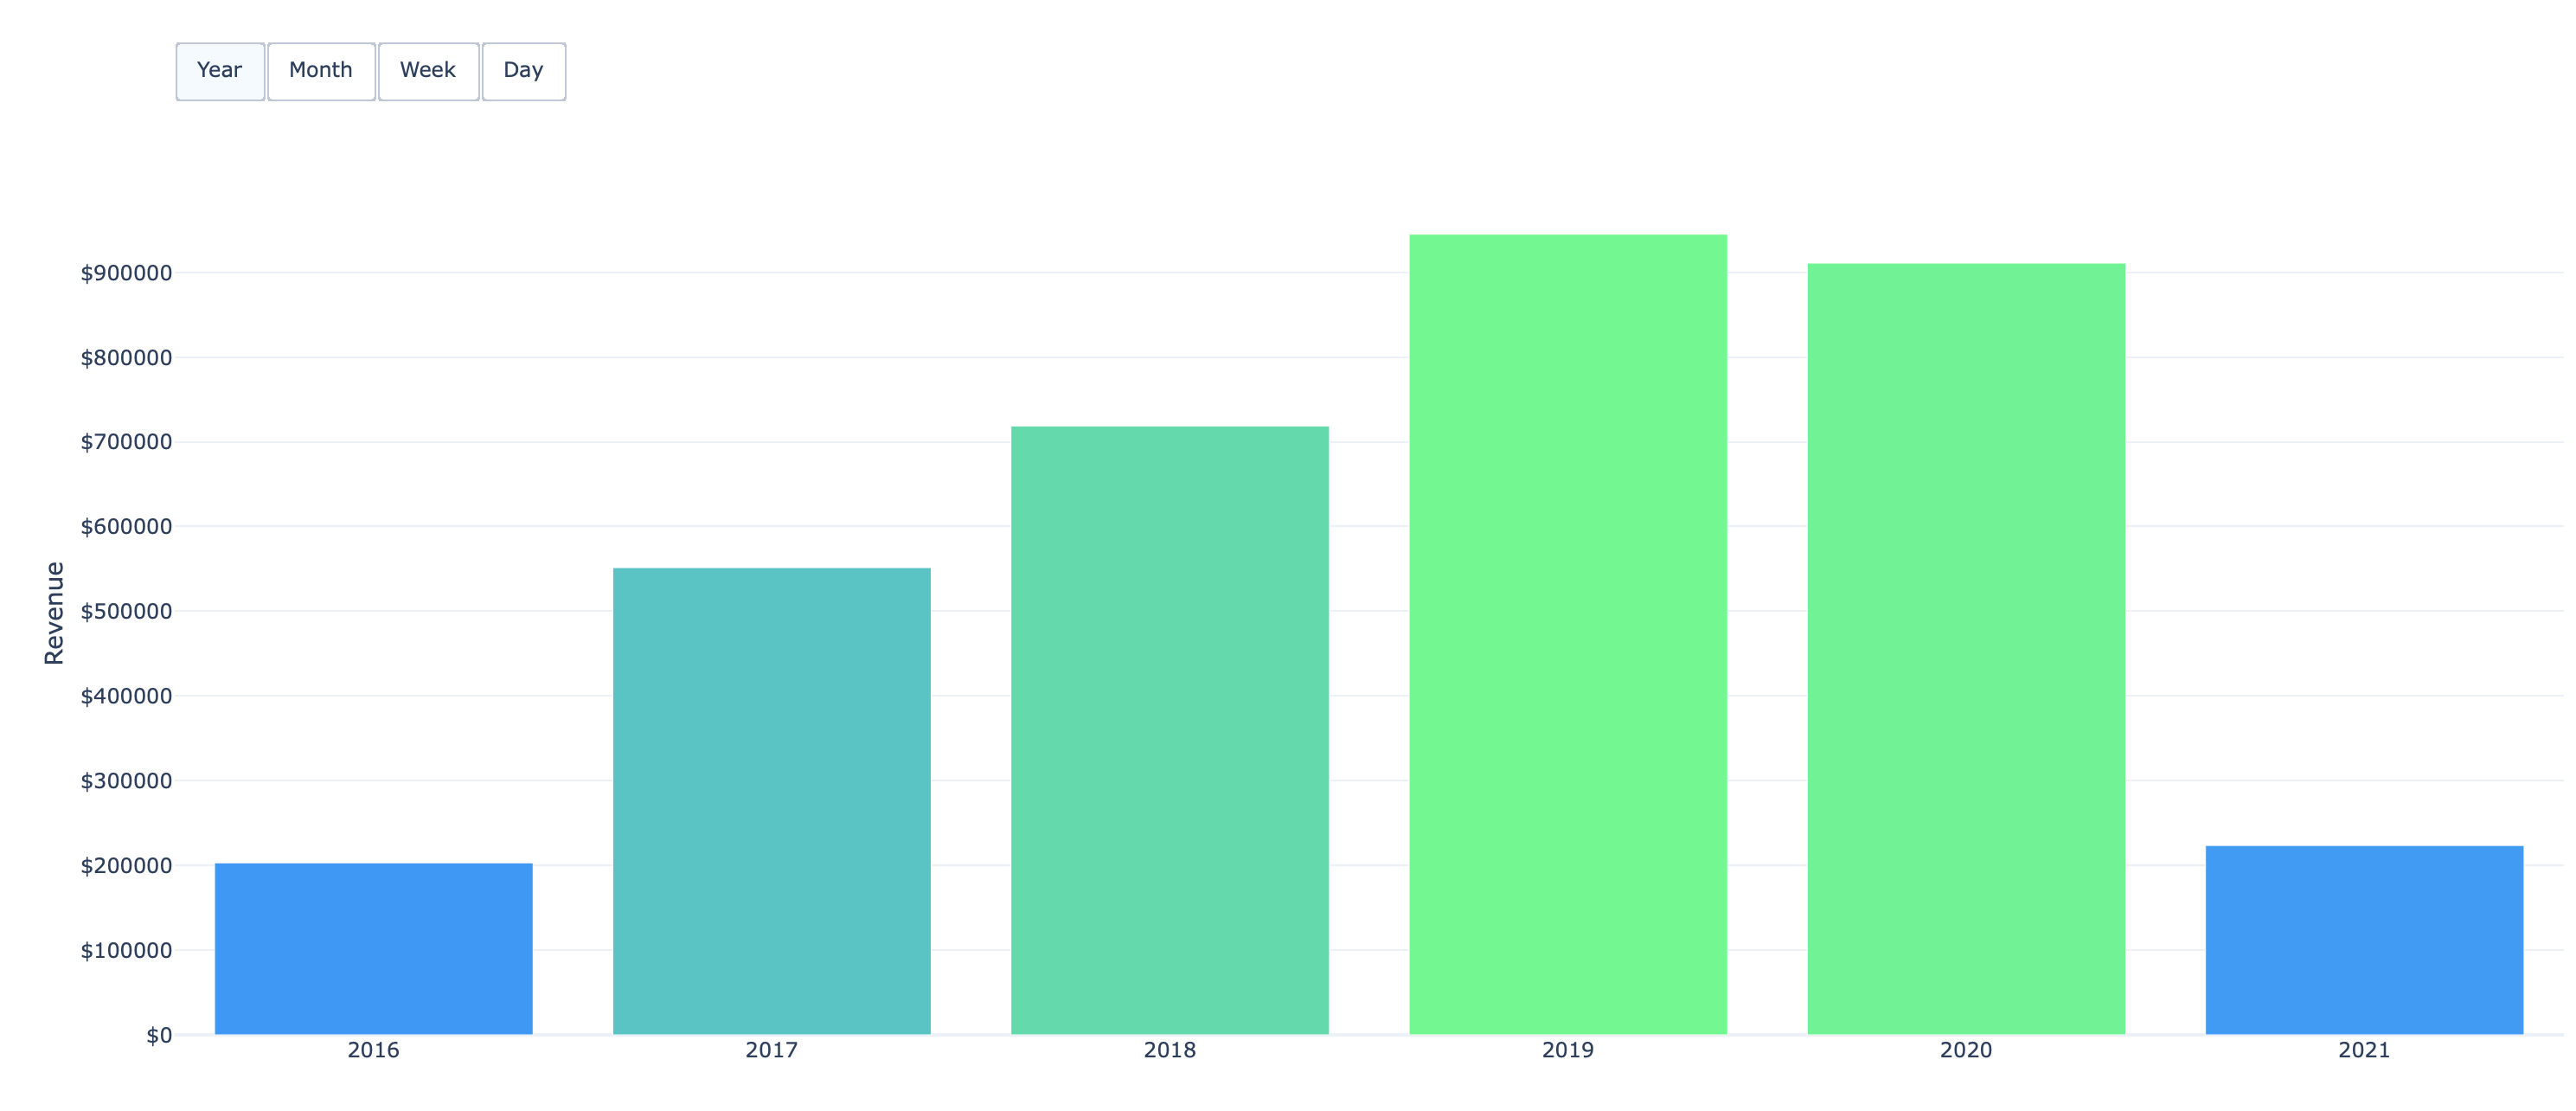
Revenue Analysis
Identify how the revenue of a product is changing throughout time
Description: Determining revenue per good helps identify the revenue trend for each product. One might be interested in finding out how the revenue of a certain product is changing throughout time.


